UV-B Measurements from a Drone

Since I began making solar UV-B measurements in the 1.5-acre field we call the Geronimo Creek Observatory in May 1988, the trees around the field have grown much taller. This can be seen in near daily fisheye photos of the zenith sky made since December 2000. On a typical clear day, around half the UV-B arrives directly from the sun and the remainder is scattered from the sky. So those growing trees have definitely reduced the full-sky UV-B measurements at my site, and to find out how much was impossible until the UAV (drone) era.

Mims_MavicPro_No_26_UVB_Radiometer_DSC00191

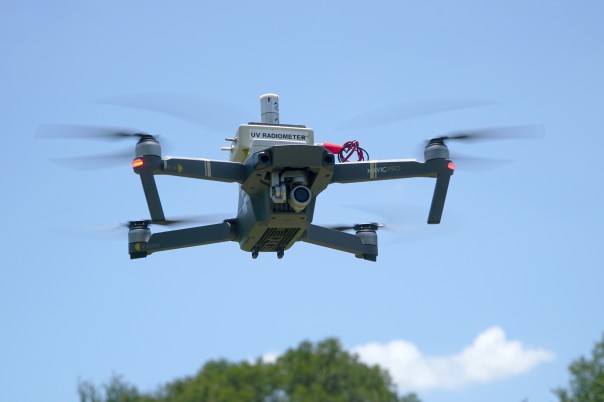
Shown here is a DJI Mavic Pro with my DIY 1994 UV-B radiometer mounted on top along with a 16-bit data logger. Several July 2017 flights of this radiometer above the trees have shown they are now blocking around 2% of the UV-B, which is much less than I expected.

UV-B dataProject1The gaps in the data were intentionally caused by placing a black rubber cap over the detector to provide references. The third trace is when the drone was hovering next to the Picture Post, which is where the drone was perched for the first and fourth traces. The radiometer was attached to the Onset data logger with Handi-Tak and the logger was attached to the Mavic’s battery with Velcro. A strip of adhesive tape across the end of the data logger helped guarantee security.

Flying this radiometer was risky, for I made in 1995 and used it extensively during two NASA-sponsored campaigns in central Brazil to study the thick smoke during the burning season, which on some days blocked 100% of the UV-B. Fortunately, the Mavic lifted the 7.5 ounce payload with no problem other than reduced battery life. I’ve also flown the radiometer from the ground up to and just above small openings in the tree canopy on our place to learn much more about the distribution of UV-B within the canopy. This is of interest, for UV-B is an effective suppressor of non-pigmented microbes, some of which are pathogenic.


What happened to the traditional role of skepticism in climate science?

Traditional science required a skeptical view of one’s own findings until they could be replicated, especially by others. Unfortunately, skepticism has been deleted from the latest edition of “On Being a Scientist,” a widely-read booklet published by the National Academies of Science. When I asked the NAS about this unfortunate deletion, they explained there was insufficient space to include this fundamental aspect of doing science. Yet I counted nearly 10 pages of white space in the new edition.

Despite the NAS change, I’ll continue to view science, including mine, through a veil of skepticism. That’s why I am concerned about what has become of the global warming/climate change movement, which is rapidly assuming the status of a paradigm that is automatically assumed correct by many of those unfamiliar with the science.

Some of those who criticize skeptics like me seem unaware of the scandals and the political and religious-like motivations behind the climate change movement. They need to become familiar with the content of the Climategate emails and the use of non-peer-reviewed data and erroneous information about Himalayan glaciers in Intergovernmental Panel on Climate Change (IPCC) reports. (Disclosure: I was an expert reviewer of the IPCC ‘s AR-5 Report.)

The IPCC scandals occurred under the leadership of former IPCC chairman Rajendra Pachauri, who acknowledged in his resignation letter that his “fight” against global warming is his “religion” and “dharma” (https://www.ipcc.ch/pdf/ar5/150224_pachauri_letter.pdf). Pachauri had to resign after charges of sexual harassment of some of his staff.

Those who doubt political motivations are behind the global warming/climate change movement, including the Paris Agreement, should simply read what major political leaders have stated. Beginning at the top is Christiana Figueres, the Executive Secretary of UNFCCC (United Nations Framework Convention on Climate Change) and the subject of this United Nations media release (http://www.unric.org/en/latest-un-buzz/29623-figueres-first-time-the-world-economy-is-transformed-intentionally):

“Figueres: First time the world economy is transformed intentionally“
Tuesday, 03 February 2015 18:34

“Christiana Figueres, the Executive Secretary of UNFCCC, warns that the fight against climate change is a process and that the necessary transformation of the world economy will not be decided at one conference or in one agreement.

“This is probably the most difficult task we have ever given ourselves, which is to intentionally transform the economic development model, for the first time in human history”, Ms Figueres stated at a press conference in Brussels.

“This is the first time in the history of mankind that we are setting ourselves the task of intentionally, within a defined period of time to change the economic development model that has been reigning for at least 150 years, since the industrial revolution.”

Scientific Studies During Brazil’s Burning Season

In 1995 NASA’s Goddard Space Flight Center (GSFC) assigned me to accompany the SCAR-B research team to Cuiaba, Brazil, during the burning season. NASA’s ozone satellite was not working, and my job was to measure the ozone layer through thick biomass smoke. During this 3-week campaign, I made many additional measurements and was surprised by the significant attenuation of solar UV-B caused by the smoke. I also noticed that many locals were experiencing respiratory distress, and, during a team meeting, I suggested that the incidence of infectious respiratory disease resulting from smoke inhalation could be exacerbated by sharply diminished UV-B that ordinarily kills airborne, infectious microbes.

In 1997, I drafted a letter to the journal Science that discussed the UV-B-respiratory disease hypothesis. The letter was sent to Brent Holben, Tom Eck and Brian Montgomery of GSFC and William Grant of NASA’s Langley Research Center, all of whom agreed to accompany the letter as co-authors. Science published our letter on 20 June 1997. This letter preceded an assignment by GSFC to return to Brazil during the 1997 burning season to extend the measurements I made in 1995 and to also conduct a study of airborne bacteria.

NASA had only one team in Brazil in 1997: my student assistant Bradley White and me. We made thousands of measurements of sunlight, the ozone layer, smoke, bacteria, fungi and a small garden we planted on day 1 during our 3-week stay at Alta Floresta and the Cristalino River. During a seminar for Alta Floresta physicians, a college student was assigned to determine the incidence of influenza during our stay. The hypothesis about enhanced respiratory disease exacerbated by diminished UV caused by thick smoke was supported by the student’s finding and our bacteria cultures (both bacteria and viruses are inactivated by UV), a result that I published in a letter to the journal Nature (20 Nov 1997).

I subsequently published a letter in Environmental Health Perspectives (2005) suggesting that avian influenza might be exacerbated by diminished UV-B caused by biomass smoke. Since this note received a number of citations in the scholarly literature, I assumed that better qualified researchers might follow up on the hypothesis. But that has apparently not happened, at least to the extent I had hoped. So I am returning to this topic in a new proposal. Meanwhile, my 1997 report to GSFC was never published, and the PDF is linked here (please allow several seconds for it to load): Mims-Brazil 1997


25 Years of Atmospheric Measurements

During May 1988 I began measuring solar UV-B using a homemade instrument that detected a sharp decline in UV-B during September 1988 when smoke from the massive Yellowstone fires drifted over Texas. By the end of 1989 I had completed work on a 4-channel sun photometer that used light-emitting diodes as spectrally selective photodiodes. I was also working on TOPS (Total Ozone Portable Spectrometer), a 2-channel UV instrument to measure the ozone layer.

On February 4, 1990, I began making daily measurements at solar noon of the ozone layer. I also continued using the LED sun photometer to measure haze (aerosol optical depth or AOD) and total column water vapor. The latter two parameters were measured with LEDs that detected at 830 nm and 940 nm. AOD was measured at 830 nm and water vapor by the ratio of the two LED signals.

The 25 years of data acquired thus far are shown in the time series plots below. The ozone plot shows the annual variation and a sharp decline in total ozone during the mid-1990s, a phenomenon also measured by the TOMS instrument aboard NASA’s Nimbus-7 satellite. The volcanic eruption of Mt. Pinatubo on June 15, 1992, played a role in the decline. Solar UV-B increased appreciably before the ozone layer began recovering. The ozone is now very close to what  it was prior to 1991. The AOD chart shows the annual variation. Sharp upward spikes are from major aerosol events, including Saharan dust from Africa, smoke from Mexico and sulfate pollution from power plants in the Tennessee and Ohio Valleys. The water vapor data show a sharp increase in 1997-98 associated with a major El Nino. Of interest is that no increase was associated with the El Nino of 2015-16. The NWS forecasts of a cold, damp winter for Texas were also unfilled.

The ozone measurements were made with a succession of 3 instruments and the AOD and water vapor measurements with the original LED sun photometer. Relevant publications are given at my main web site.

Mims_Ozone_1990_2016Mims_Optical_Depth_1990_2016Mims_Water_Vapor_1990_2016

About Forrest M. Mims III

I have worked as a freelance writer and photographer since 1970. I also design, build and use a variety of atmospheric monitoring instruments and have consulted or performed field work for NOAA, NASA (GSFC and LaRC), National Geographic Society, EPA, USDA (through Colorado State University), GLOBE, TERC and the Concord Consortium.

My main website is http://www.forrestmims.org. Some of the science I do is at the main site and also at http://www.sunandsky.net.

My Radio Shack books are available from Master Publishing at http://www.forrestmims.com and http://www.amazon.com. The Amazon site also includes some of my non-Radio Shack books.

“Hawaii’s Mauna Loa Observatory: Fifty Years of Monitoring the Atmosphere” (University of Hawaii Press, 1912) is available from Amazon and http://www.uhpress.hawaii.edu/books.aspx

The photo above shows the rings of a century old baldcypress (Taxodium distichum) that stood on the bank of the Guadalupe River in Central Texas until downed by a major flood in 2002. The rings clearly show the impact of the drought of 1954-56.

The header photo is a collage of five sunset images of the antitwilight glow made by a Phantom 4 UAV hovering at 33 meters. The pink arc suggests a very clean sky. The dark region under the arc is Earth’s shadow.